

| Perf Views | ||
|---|---|---|
|
|
|
|
| Profiling Configuration | Sessions | |
A Perf view is where all the profiling results can be easily read. There are a few different views that may be activated depending on the kind of information a user is interested in.
The Perf Tree View stores profiling information in a tree-like hierarchy.
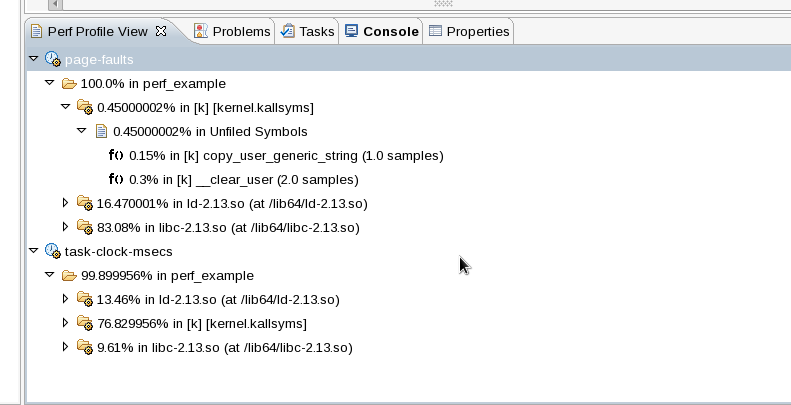
The tree structure displayed above describes one profile of one or more events in the following manner:
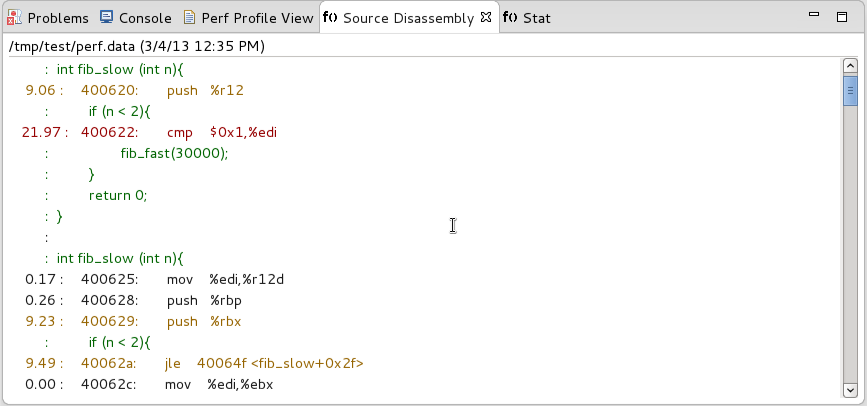
Display the source code of the targeted program alongside its assembly code. This also lists the percentage of samples collected at each instruction.
This option may be enabled from the launch configuration options for Perf.
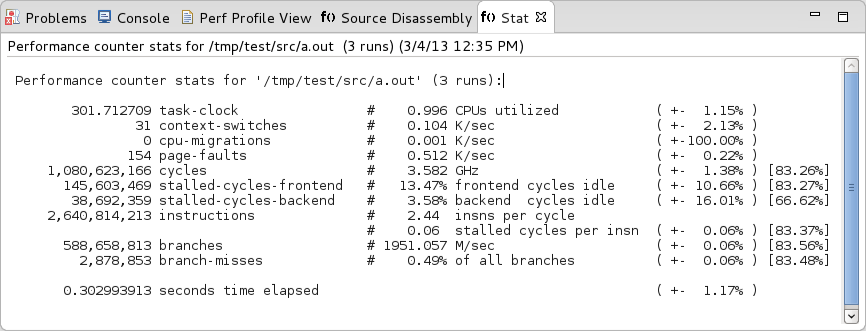
Display various event information about the execution of the targeted program.
This option may be enabled from the launch configuration options for Perf.
|
|

|
|
| Profiling Configuration | Sessions |