

| GProf View | ||
|---|---|---|
|
|
|
|
| Profiling Using GProf | Troubleshooting | |
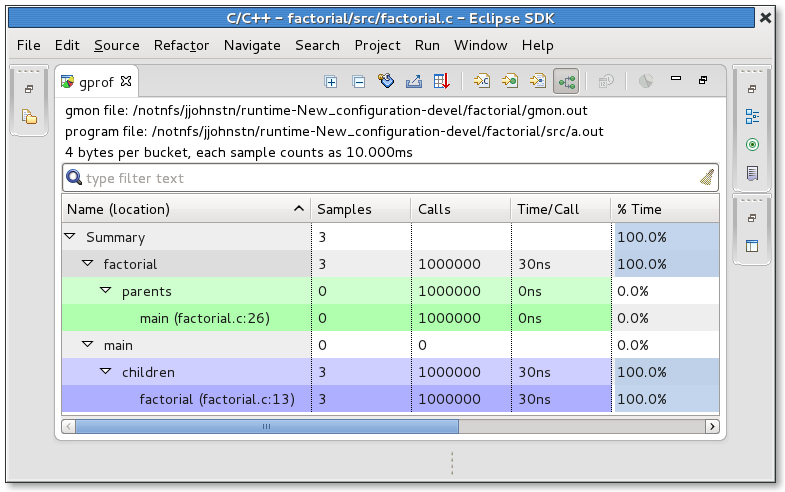
The Gprof view shows which parts of the program consume most of the execution time. It also provides call graph infomation for each function.
Several buttons are available in the toolbar.
 : "Export to CSV" button allows you to export the gprof result as a CSV text file, suitable for any spreadsheet.
 : "Sort samples per file" button displays gprof result sorted by file.
 : "Sort samples per function" button displays gprof result sorted by function.
 : "Sort samples per line" button displays gprof result sorted by line.
 : "Display function call graph" button displays gprof result as a call graph.
 : "Switch samples/time" button allows you to switch result display from samples to time and vice-versa.
 : "Create Chart..." button allows you to create a BIRT chart, with the current lines selected in the gprof result view.
If program is compiled with debug option (e.g. "-g"), double-clicking on a item in the result will open the corresponding source location.
|
|

|
|
| Profiling Using GProf | Troubleshooting |