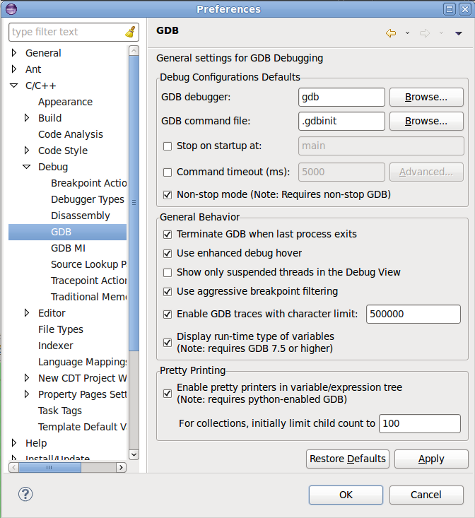
GDB Debugging Preferences
Use this preferences panel to control how the C/C++ debugger behaves when debugging with GDB, specifically when using a GDB (DSF) launcher.
| Category | Option | Description |
|---|---|---|
| Debug Configurations Defaults | ||
| GDB debugger | Specifies the GDB debugger binary that will be used by default for each newly created debug launch. Using an absolute path will directly point to the binary (e.g, /home/user/myGdb), while using a binary name will have C/C++ look through the PATH variable for that binary (e.g., myGdb). This can be useful of your GDB binary is not named 'gdb'. Each launch configuration allows to override this setting in the Debugger tab. | |
| GDB command file | Specifies the GDB debugger command file that will be used by default for each newly created debug launch. This can be useful if you often/always want to use a GDB command file for your launches. Each launch configuration allows to override this setting in the Debugger tab. | |
| Stop on startup | When checked, the C/C++ debugger will stop execution at the specified symbol when launching or re-starting a process. By default, this setting makes the C/C++ debugger stop when entering 'main'. | |
| Command timeout | When checked, the C/C++ debugger will abort the debug session if any command sent
to GDB does not get an answer before the specified timeout. Using this can prevent debug sessions from hanging forever
when debugging un-reliable targets.
Using the Advanced... button allows to set a different timeout for individual commands. A value of zero can be used to specify "no timeout" for a particular command. MI commands must start with a hyphen ('-'). For example, '-target-select'. |
|
| Non-stop mode | When checked, the C/C++ debugger will run in non-stop mode for each newly created debug launch. Non-stop mode allows each thread of a debug session to be controlled independently. This allows to stop one or more threads while leaving others running. In contrast, all-stop mode interrupts and resumes all threads at the same time. Note that non-stop mode is only available starting with GDB 7.0. | |
| General Behavior | ||
| Terminate GDB when last process exits | When checked, the C/C++ debugger will terminate the GDB process (on the host) after all the target processes it is debugging have terminated. Otherwise it will leave it running. It can be useful to keep GDB running if you expect to want to attach or create new processes to debug after the previously debugged processes have terminated. | |
| Use enhanced debug hover | When checked, hovering over an expression in the editor during a
debug session will bring up an enhanced expression evaluation control. Otherwise, a more basic
control is used. This, of course, assumes that you have the debugger's hovering capability turned on in
C/C++ > Editor > Hovers. If not, this checkbox has no effect.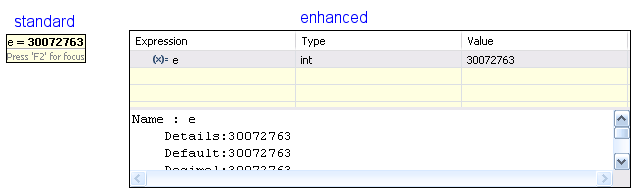 |
|
| Show only suspended threads in the Debug view | When checked, the Debug view will only show threads that are suspended. When dealing with a large number of threads, this helps focus on the threads being inspected. Obviously, this option is only valuable in non-stop mode, where some threads can run while others are stopped. | |
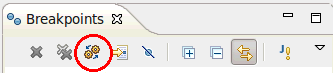
| Use aggressive breakpoint filtering | When checked, the button "Show Breakpoints Supported by Selected Target"
of the Breakpoints view will only show the breakpoints that affect the currently selected C/C++ debug context
(e.g., thread, process). Otherwise, "Show Breakpoints Supported by Selected Target" will show all breakpoints
that are for any C/C++ target.
|
|
| Enable GDB traces | When checked, the debug session will produce an additional console which
will contain all the gdb/mi activity. Basically, this details the interaction between the C/C++ debugger and GDB.
This information is often critical when the debugger is not behaving as you expect. Include this console output
when submitting a bugzilla report against the C/C++ debugger. It is recommended to keep this setting enabled at
all times, as it does not cause any negative effect.
Once the number of characters specified by the limit field is reached, older trace lines will be discarded gradually. This is to avoid these traces consuming too much memory, for very long debug sessions. |
|
| Display run-time type of variables | When checked, the C/C++ debugger will show the actual variable type (not the declared one) in Variables and Expressions views. Not only does this allow to see what is the current run-time type of a variable, but it allows to access fields that may not be in the base class. Note that this feature will only work starting with GDB 7.5. | |
| Pretty Printing | ||
| Enable pretty printers in variable/expression tree | When checked, the C/C++ Debugger will display STL types in a user-friendly fashion. This can be seen in the Variables and Expressions views, as well as in the advanced editor hover. For example, Maps, Lists and Vectors will be shown in an array-style format instead of showing the details of the actual implementation of the data struture. Note that pretty printing requires a GDB that has python support enabled and the user of STL pretty-printers. | |
| For collections, initially limit child count to | When using pretty printing, collections (e.g., Maps, Lists, etc) can contain a large number of elements. Trying to display all this children at once can cause very poor responsiveness. This value will limit the number of children displayed initially, while allowing the user to manually request more children directly from the view. |
![]()
