Debugging a generated RT application using CDT
This is a short introduction on how to use CDT to debug C++ code generated from an RT model.
- Start by building a transformation configuration where the "Compile arguments" property contains $(DEBUG_TAG). This ensures that generated code is built with a flag (-g when using gcc), which includes debug information in the binaries. If you also want to debug code inside the Target RTS, build a version of it that includes debug information. Follow these instructions: Debugging the RT services library
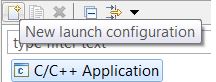
- Open the Debug Configurations dialog (Run - Debug Configurations). Select "C/C++ Application" in the left list and click New launch configuration:
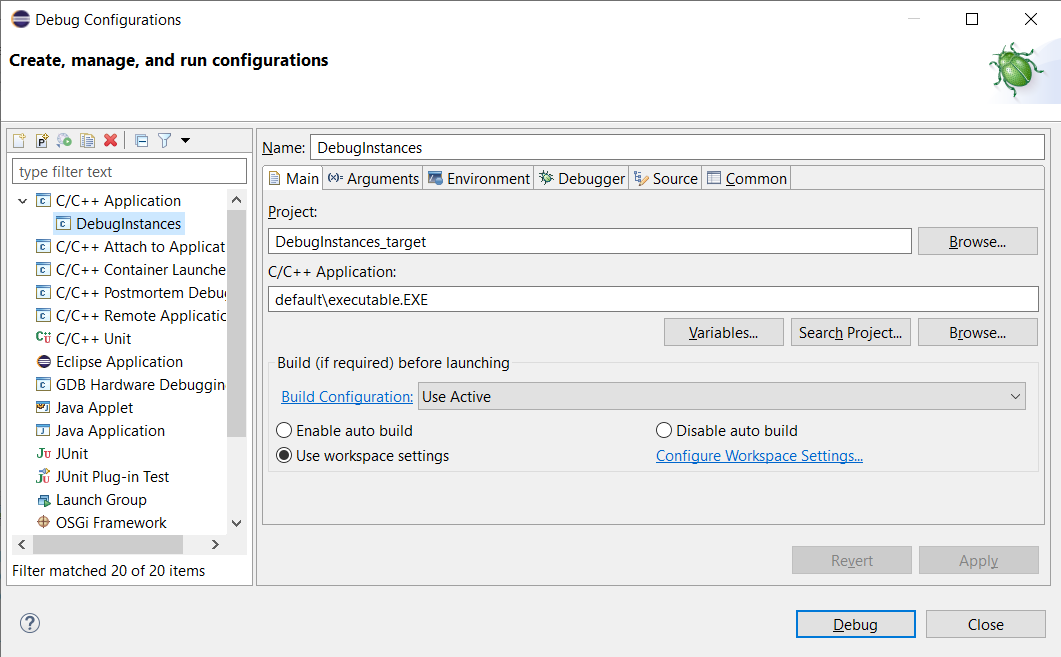
- Give the new debug configuration a good name. Also, ensure the "Project" setting specifies the project that contains the top capsule and that the path to the C/C++ application is correct for your built executable.
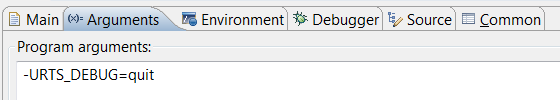
- In the Arguments tab, add the -URTS_DEBUG=quit argument. This ensures that the application quits from the command-line debugger, which by default is entered at application start-up. Alternatively you can use the -obslisten=12345 argument if you prefer to not start C++ debugging until the Model Debugger has attached to the executable (if required replace 12345 with a valid port number for your machine).
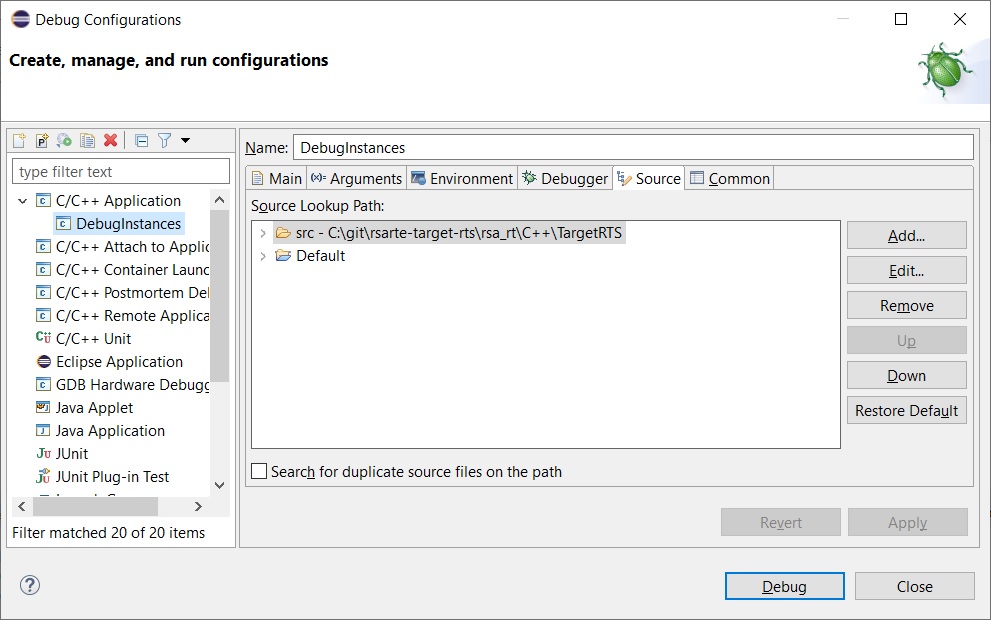
- CDT, by default, looks for source files relative to your workspace folder. If they are placed somewhere else, you can set up a Source Lookup Path in the Source tab. For example you can add a File System Directory to specify the location of the TargetRTS source code in case you want to debug TargetRTS code.
- Click the Debug button to start the debug session. The application starts up and execution is suspended in the main function. You are prompted to switch to the Debug perspective.
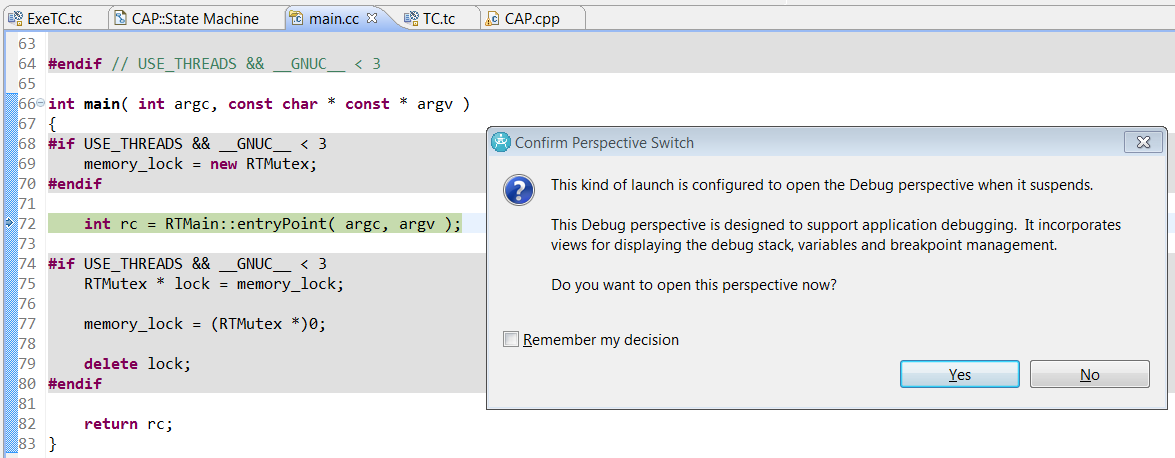
The main function is, by default, in the Target RTS, so if you have not followed the instructions in Debugging the RT services library you do not see the source code for this function.
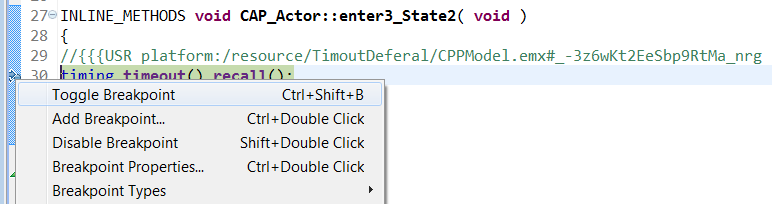
- Before resuming execution, you might want to set a few breakpoints at places of interest. You can set such breakpoints by opening the CDT editor on a generated C++ file, right-click in the margin, and select Toggle Breakpoint.
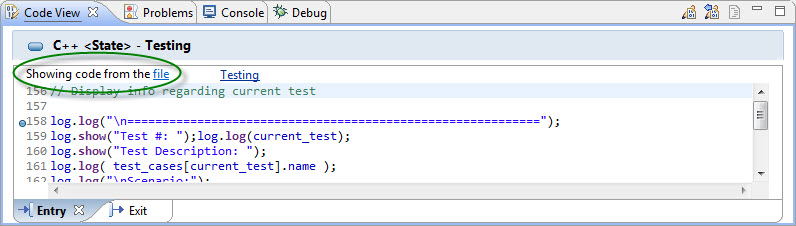
You can also set breakpoints from the Code editor or Code view when viewing code from a generated file.
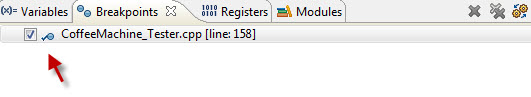
The breakpoints you set appear in the Breakpoints view:
- Resume execution by clicking the Resume button in the debug toolbar
When one of your breakpoints is encountered, you can start debugging your application using all features provided by the CDT debugger. Learn more about the CDT debugger in the Eclipse documentation.